Watch your AI agents work.
vapviz is a self-hostable tracer & visualizer for AI agent pipelines. One line in your code, and every step, tool call, and model call shows up live — as an interactive graph, and as a pixel office where your agents actually walk around and do the work.
pip install vapviz
Why vapviz
Your agents are working. Can you see them?
Agent pipelines are invisible by default — a wall of logs at best. vapviz turns them into something you can watch, inspect, and control. Local-first: your traces stay on your machine.
See everything, live
Every step, tool call, and model call streams into an interactive graph as it happens — with inputs, outputs, durations, token usage, and errors on every node.
Know what it costs
Per-call and per-run cost, computed from a built-in pricing table, plus a cross-run dashboard: spend by model, tokens, success rate. No more surprise bills.
Stay in control
Pause, resume, or stop a running agent from the UI. Cooperative and safe: pause parks it between steps, stop ends the run with an honest "stopped" — not a fake error.
Quickstart
Tracing in five minutes
No SDK ceremony, no cloud account. Install the package, wrap your agent in one context manager, open the browser.
Install
The published wheel ships the UI — no Node, no build step.
$ pip install vapviz
Trace your agent
One context manager for the run, one per step. Nesting is automatic — no manual IDs, ever.
import vapviz

with vapviz.trace("My Agent") as run:
    with run.step("fetch_data", kind="tool") as step:
        step.set_input({"url": "https://api.example.com/data"})
        data = fetch()
        step.set_output({"rows": len(data)})
Watch it work
Start the server and open the browser — the graph draws itself
while your agent runs. Add --db and every run is
kept.
$ vapviz serve --db vapviz.db
# UI + API at http://localhost:8001
Or auto-instrument
Already on OpenAI, Anthropic, LangChain/LangGraph, CrewAI, Pydantic AI, LlamaIndex, or AutoGen? One call hooks the whole framework.
client = OpenAI()
vapviz.patch_openai(client)   # every model call, traced
The tour
One tracer, four ways to look at it
The same event stream drives every view — pick the altitude: the whole fleet, one run as theater, the raw graph, or the numbers.
The Office Building
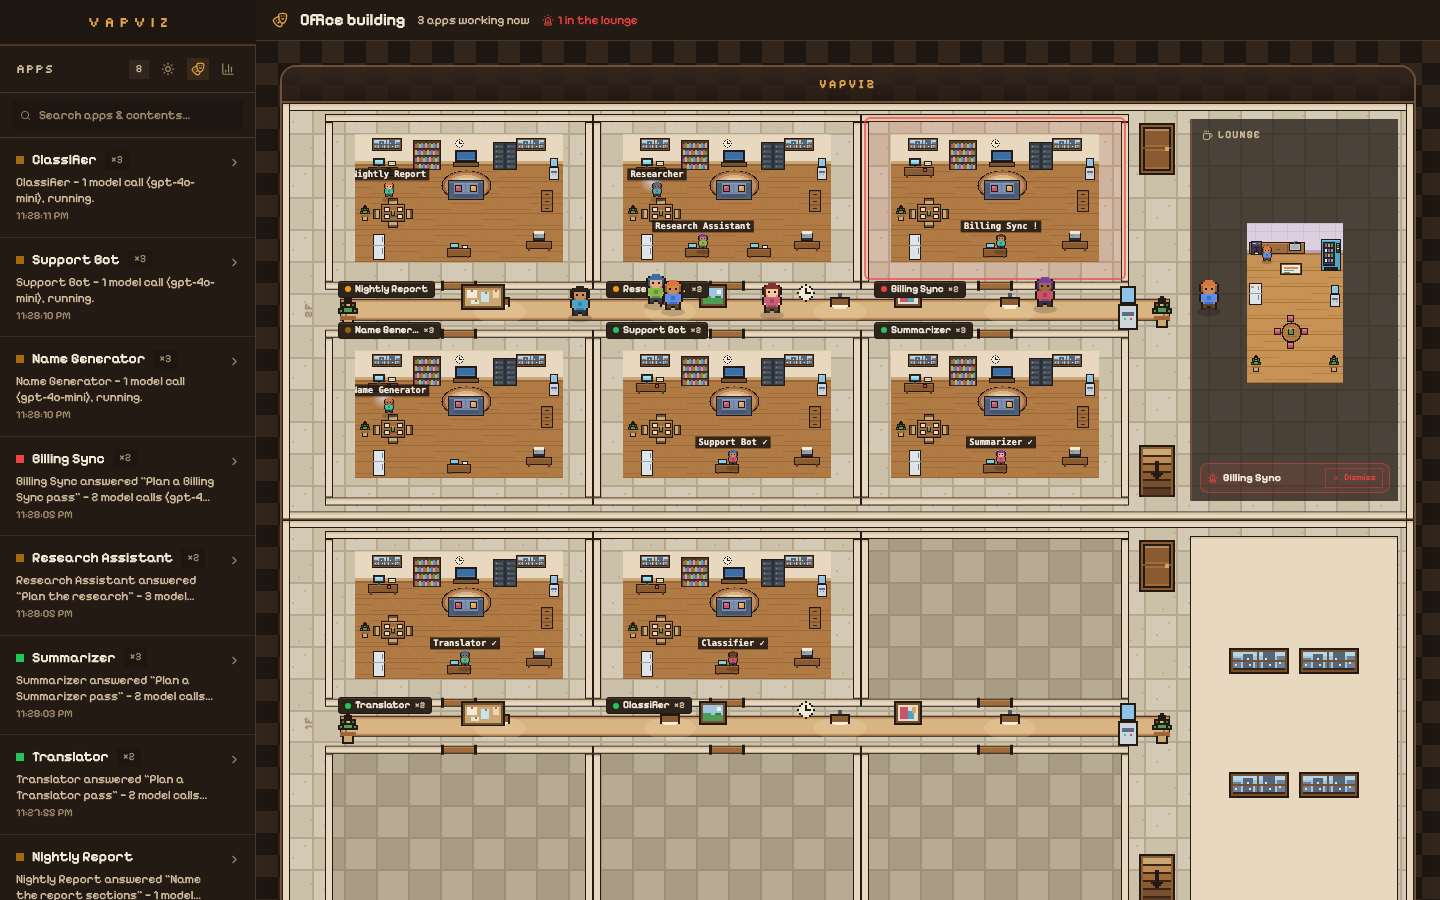
Your whole fleet on one screen. Every app owns a room in a pixel office building — a re-run lights the same room back up, a failing app turns its room red and its agents wait it out in the rooftop lounge. If someone's milling about on the corridor, work is happening — the building never lies.
The Theater
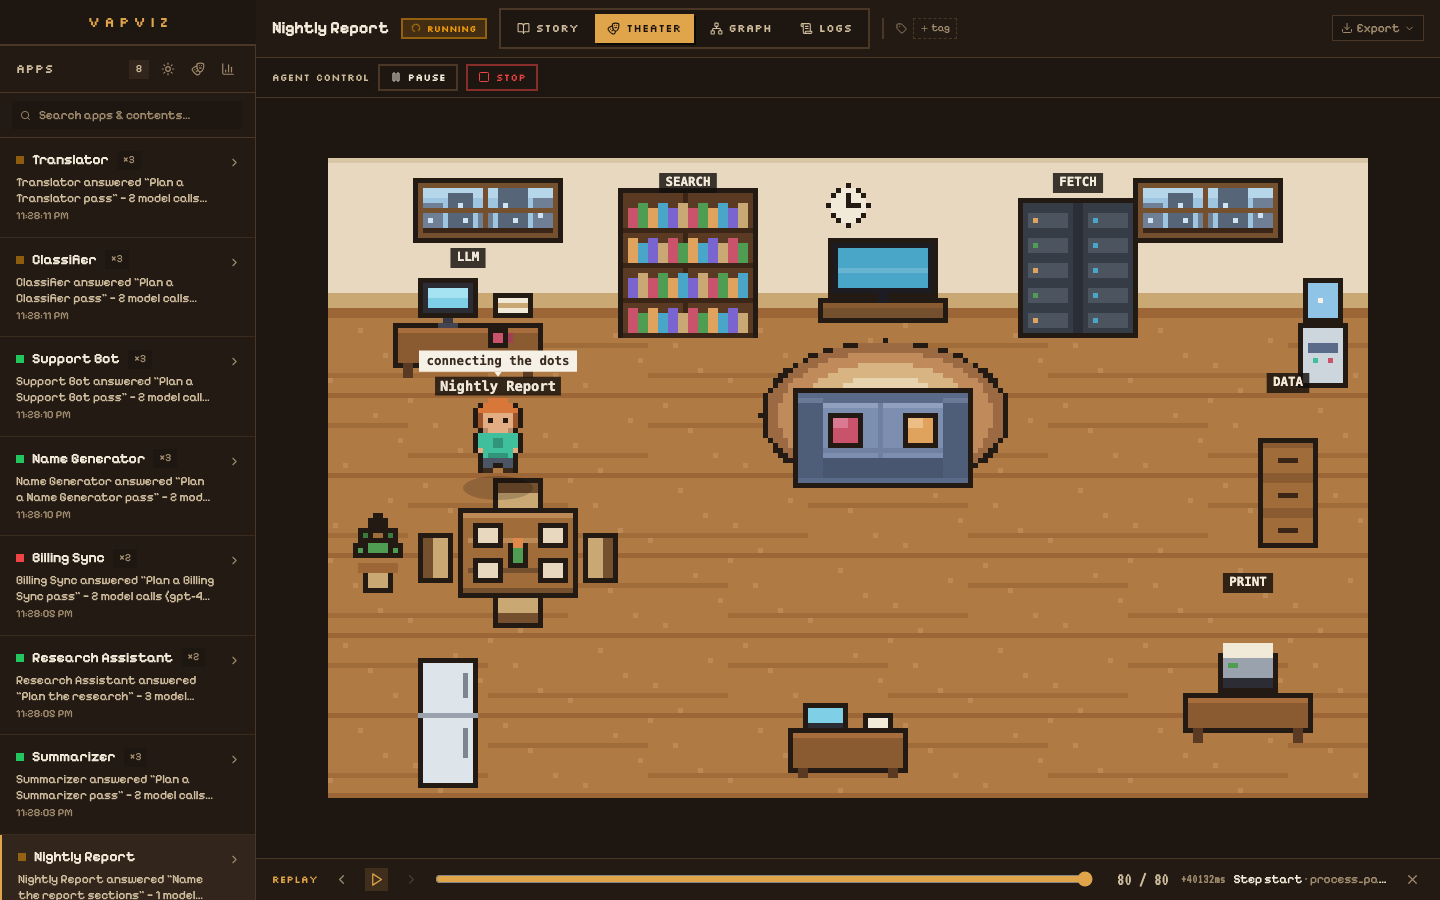
One run, up close. Each agent is a hand-drawn sprite at its own desk; it walks to the LLM desk to think and to a tool station to work, speech bubble overhead. Live, or replayed event-by-event with the scrubber.
The graph
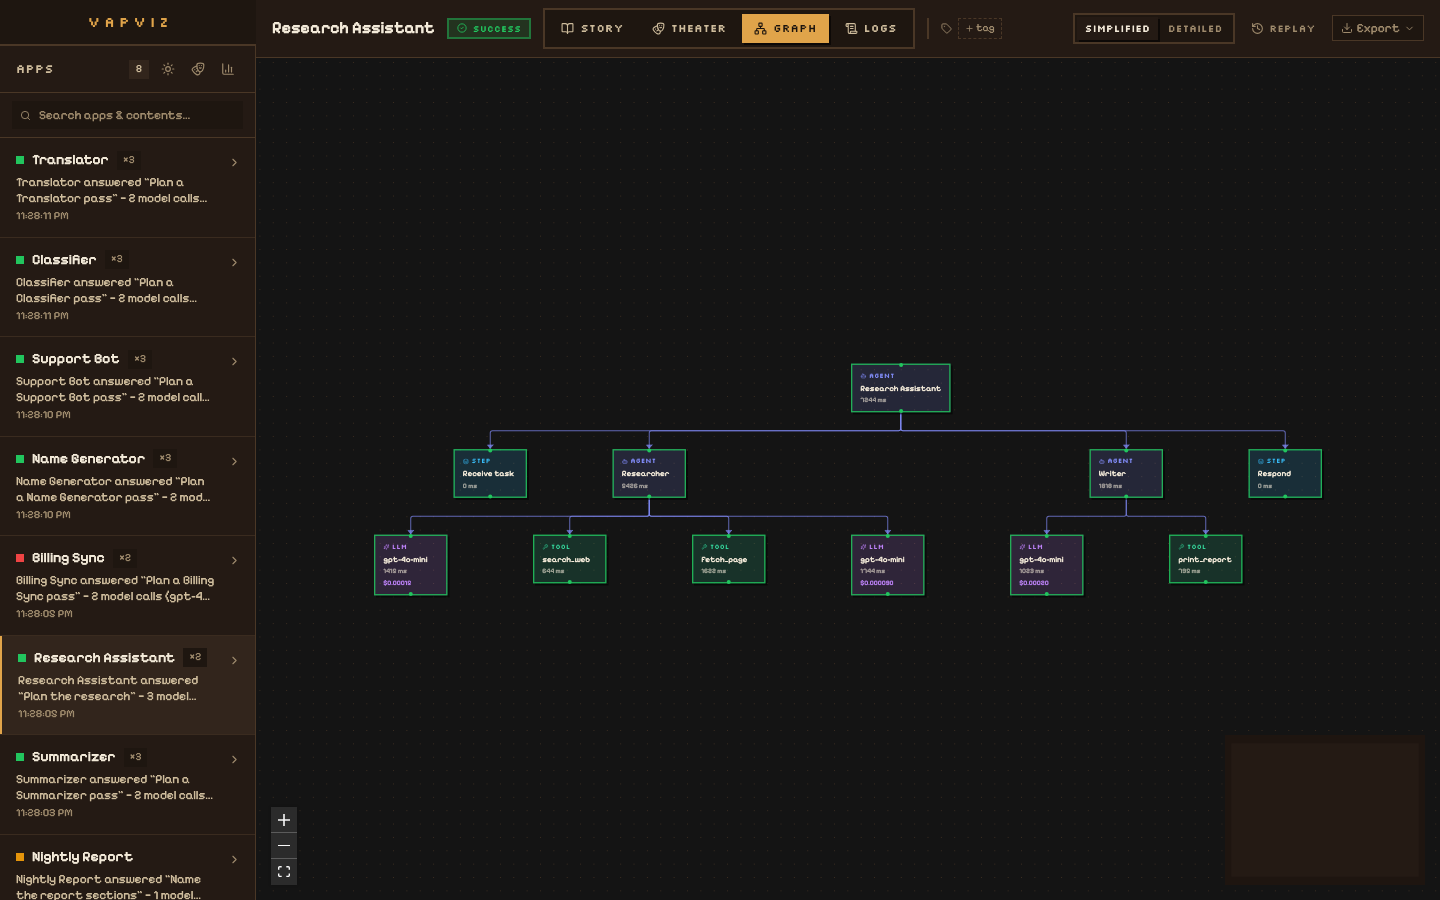
The engineer's view: a live DAG of the run. Node color is the kind of work, the border is its status; click any node for inputs, outputs, token usage, duration, and the exact error. Compare any two runs side by side.
The dashboard
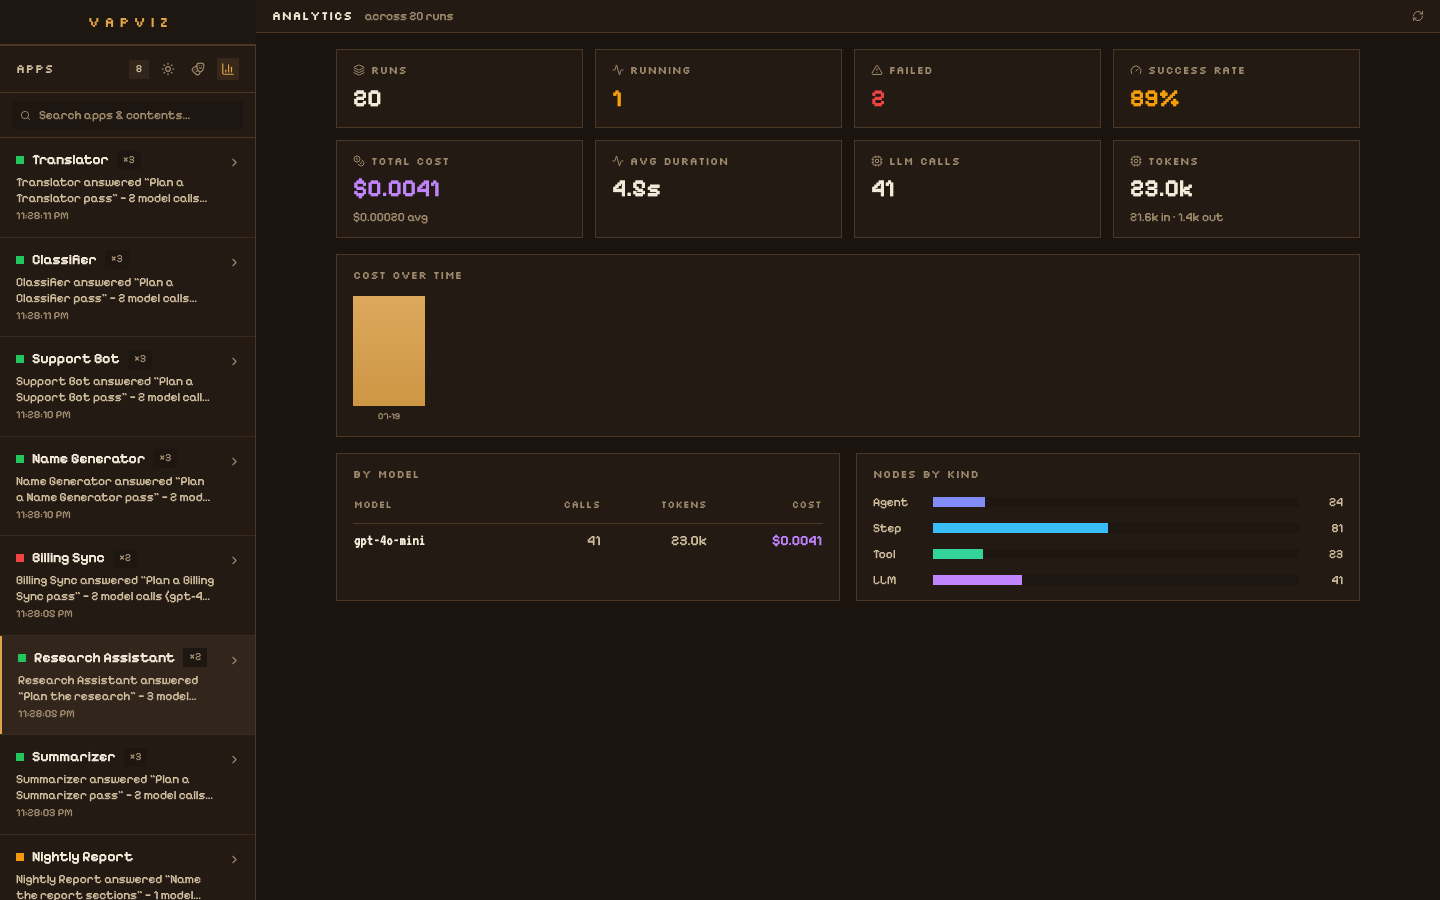
Cross-run analytics: total spend, tokens in and out, success rate, cost by model, cost over time. Budgets flag the runs that blow their limits; evals score them like regression tests.
Plays well with
Your stack, already covered
Auto-instrumentation for the major agent frameworks and SDKs —
or use the plain trace/step API anywhere,
and push events over HTTP from any language.